|
[ <- main ]
Plot
[ latest versions
| plan
| license
| compiling
| usage
| datafile format
| screenshots
]
Plot is a program for plotting time-based data without hassle, with
rapid navigation controls and with an average learning curve. The
performance does not drop dramatically with increased filesize - data
files with millions of data points are handled with ease. Mostly it's
the amount of available RAM that limits the amount of data that can be
displayed fast enough to be called "interactive".
The main distribution (represented by this page) uses C & GTK and
is compilable under Linux, and since 0.29 also Mingw and Cygwin (see
README.cygwin.txt inside the archive). I'll happily receive patches to
sources, makefiles, or whatever you did to get it running, get it
working better/faster etc. See main page for
contact info.
Technologies used:
Valgrind,
Glade 3,
Libglade,
Gamin,
Gettext.
Latest version
Version 0.30 |
25.03.2011 |
download source (238k)
- End user changes
- "New view" crash bugfix
- New "Close view" button below vertical scroll bars
- Developer changes
⊞ Older versions |
browse files
Version 0.29 |
12.01.2010 |
download source (241k)
- End user changes
- Commandline support, both for direct plotting without GUI (and even X) and for setting defaults. See plot2 --help.
- Cairo export option which gives smooth PNGs, PostScript, PDF & SVG files. Only available from commandline in this release, and must be explicitly selected using "-b cairo" argument.
- Added self-advertising.
- Fixed multiple segfaults.
- Added tools/ directory with shell scripts for producing & processing plot files.
- Support duplicate timestamps by advancing time by one millisecond.
- "Show relative time" in Options menu.
- Display fixes.
- Support new '#!headers' directive which allows can be used to change the column headings in the middle of a plot file. This is most useful if more columns are added later in the file, or if the header names are not known yet in the beginning of the file. When tailing, if the user has already edited some of the column headings, they will not be replaced - however the user can be reset the heading by right-clicking in the plot settings table.
- Add new columns that appear while tailing.
- Show loaded files in window title.
- Updates plot settings table (available through one of the buttons in the lower left corner):
- Show plot color
- Show plotfile & column id
- Show "Last" value for columns
- Allow sorting by any column
- Right-click menu now has "Restore original name" option
- Get rid of info if plotfiles are removed
- Search (click somewhere in the table and start typing a substring to search for) is now case-sensitive
- Improve visual presentation of min/max values
- FAM detection improved
- 64-bit fixes.
- Developer changes (generic code only, not GTK or Cairo code)
- The my_dataset_item_t struct has a new defaultname field, which is the original/latest column name spotted in the file, provided in case user wants to restore an edited column name. Also added name_locked which stops tailing from resetting the name.
- The my_dataset_item_t struct has a new void *user_data field for any data the user may want to attach to the column.
- The my_dataset_t struct also has the same new fields.
- update_dataset() return type changed to int (it should really be an enum, maybe in 0.30 :).
- Added initial implementation for calculating logarithmic scales, but not used anywhere.
- Added new get_size() method to paintapi for querying surface size.
- Improved paintapi draw_segments() method documentation.
- New struct for logo drawing in my_plot_draw_t struct.
NOTE NOTE!!
The Makefiles of 0.28 and earlier refer to a non-existent bsed program! You can download it from here -OR- replace all occurences of "bsed" with "perl -i -pe" (without the quotes) in the Makefile.
Version 0.28 |
18.02.2007 |
download source (217k)
- End user changes
- Drawing bugs introduced in 0.27 fixed including Bug #81.
- Fixed data loading bug - if last line did not contain all data columns, the amount of columns shown was reduced.
Version 0.27 |
07.02.2007 |
download source (217k)
- End user changes
- Lots of drawing bugs fixed including Bug #1 and #80.
- Added support for drawing data in "steps" mode in addition to the old "interpolation" mode.
- Preferences panel and properties dialog for adjusting basic line properties.
- "Visitor mode" - doublesize font toggle by
Ctrl-+ (feature request #3 implemented by Mikko Tiihonen)
- Separate SNMP monitoring tool included that monitors given OIDs at regular intervals, producing data files directly suitable for the Plot app (and works really nice with "tailing" aka automatic refreshing :).
- New directive support in datafiles. See dataformat section for directives, examples & description.
- Miscellanneous memory usage bugfixes.
- Improved tolerance for garbage in data files.
- Avoid some unnecessary redraws
- Fixed refresh bug in automatic refresh code.
- Developer changes
- dataset->name is now a separate malloced (strduped) string rather than a pointer into dataset->path_utf8
- Support for printing x axis timestamps relative to some given time
- Errors during data file loading are now collected to dataset->parse_errors field for platform-specific usage (by Mikko Tiihonen)
Version 0.26 |
09.04.2006 |
download source (193k)
- End user changes
- New "zoom out" mode when "tailing" - now the program can zoom out to show new data as an alternative to moving the plot.
- Some fixes regarding how some interactive mouse commands work in "tail" mode
- Remove some flickering on redraw
- Developer changes
Version 0.25 |
09.04.2006 |
download source (192k)
- End user changes
- Bookmarks can now be added interactively, no load & save yet..
- Space now does "Show all"
- Improved spacing & sizing of various graphical elements when using large fonts
- Fixed zoom history bug & improved zoom history
- Improved plot refresh and fixed some display bugs
- Developer changes
bookmarks struct inside my_plot_draw_t now has triangle_size indicating how bing the drawn bookmark triangle is.
Version 0.24 |
02.04.2006 |
download source (188k)
- End user changes
- Keyboard navigation (see usage below)
- Gridlines & axis values are now drawn on top of plot to make sure they are always visible
- Menu option to toggle line markers
- Cursor shape now changes context-sensitively
- Support non-ASCII filenames in non-UTF-8 systems
- Developer changes
- Moved code from
plot_draw.xc into 4 new files plot_draw_{bookmark,grids,legend,lines}.xc
- Categorized variables into groups in
plot_draw structs
- Glade menubar translation comments are now autogenerated by Makefile
all target
- New required system-specific
filename_to_utf8() function (see system.xh for details)
my_dataset_t->path renamed to path_systemmy_dataset_t->path_utf8 now contains utf-8 version of the file pathmy_dataset_t->name now contains utf-8 version of the file name
Version 0.23 |
01.04.2006 |
download source (186k)
- End user changes
- Further improved min/max plotting along with some bugfixes
- Minimum displayable y range fix
- FPS indicator in main window ;)
- Developer changes
arr_find_within() array api function for searching within specified range onlyplot_draw_calc_x_minmax() and plot_draw_calc_y_minmax() added for calculating suitable scrollbar rangesutil.x[ch] renamed to misc-util.x[ch]types.xh renamed to plot-types.xh- Removed the ambiguous
LINE_MODE_DIFF mode
- The
my_plot_draw_t now has draw_min_max_lines and draw_average_line (for turning them on/off)
Version 0.22 |
26.03.2006 |
download source (185k)
- End user changes
- Fixed y-range to not go beserk if all values in a dataset are the same
- Nice min/max span plotting implemented by Mikko Tiihonen which also improves plotting speed
- Developer changes
arr_ensure array api function renamed to arr_set_length- New
draw_segments() function in paintapi
- Bookmark code that makes labels avoid each other and legend also jump around when labels get close
- dataset items no longer have null names, instead they are now
"item %d"
Version 0.21 |
12.03.2006 |
download source (180k)
- End user changes
- Internationalization already with finnish language support!
- Sample text file included
- Support for "days since epoch" timestamps in datafiles
- Optimized grid drawing a bit (still more to do)
- Improved legend names
- Fullscreen toggle with
Ctrl-Enter
- Developer changes
- Bookmark paint code along with paintapi extension
draw_closed_path()
- New
plot_draw_clone() function
Version 0.20 |
10.03.2006 |
download source (72k)
- End user changes
- Optimized datafile reading
- Added support for
nan, NaN and NAN values in datafiles
- Fixed background bug in "New view" operation
- Developer changes
- New test-dataset-read tool for testing datafile reading only
Version 0.19 |
10.03.2006 |
download source (71k)
- End user changes
- Detects more bogus timestamps in datafiles
- Avoid some grid flickering
- Optimized datafile reading
- Developer changes
- New directory structure
- New functions
plot_draw_check_if_hit_legend_box() and plot_draw_check_if_hit_legend_item()
- Moved 1200 lines of code from plot2.xc to new files
Plan
Version 1.0 |
??.??.2???
NOTE: If you think something more should be on this list,
please send me mail! See main page for contact
info.
- End user changes
- Hoovering the plot should pop up x,y values after a delay
- Avoid most common console error messages and use popup dialogs instead
- Bookmarks (attach a note to an x coordinate)
- Legend on-off toggle by direct keyboard shortcut (or maybe rotate through the three states)
- Attempt to support non-ascii filename display
- In-program timezone switching (currently only possible through TZ environment variable)
- Support "tailing" without gamin / fam libraries installed
- Support specifying start & end dates on commandline
- Distribution changes
- Provide binary builds for Fedora & Cygwin
- Developer changes
- Possibly generalize
update_minmax() for common use
License
The program is distributed under the GPL v2 license.
Compiling
To compile, you need at least:
- GTK+ 2.4 or newer
- libglade 2.4 or newer
- GCC with C99 support
- Perl
The program also makes use of (but does not require):
- some GTK+ 2.6 and GTK+ 2.8 features
- FAM for "tailing" files a'la
tail -f (install the package gamin if you don't have it already)
- gettext
- intltool
Once the required dependencies above are met, you can compile the program by:
make
If the optional dependencies change, recompile by:
make distclean
make
There are usually some warnings when compiling, don't worry too much about them.. we do that for you :)
Using the plotter
Example usage (sample.txt is included in the package):
./plot2 sample.txt
Control basics - the scrollbars have tooltips and the rest of the controls are available through the menu. Here goes:
- Left mouse
- Drag the data around. NOTE: Initially the view is zoomed out, so it can't be moved.
- Shift + Left mouse
- Same as Left mouse, with 4 times dragging speed.
- Ctrl + Left mouse
- Zoom area. Click and drag a rectangle to select the area to zoom. If you get lost, hit the "Show all" button in the lower left corner.
- Right mouse
- Zoom interactively. While keeping the mouse pressed, drag the mouse down & right to zoom in and up & left to zoom out.
- Shift + Right mouse
- Same as right mouse, at 4 times zooming speed.
- Arrow buttons in lower left corner
- These work like back & forward in your browser - they switch between recent views.
- Arrow keys / Numpad keys
- Move data around. NOTE: Initially the view is zoomed out, so it can't be moved.
- Shift + Arrow keys / Numpad keys
- Zoom data. Use down & right to zoom in and up & left to zoom out.
- Space
- Zoom out fully.
- Ctrl + T
- Toggle tailing aka autorefresh mode.
- Ctrl + Enter
- Toggle full-screen mode. (plot-0.21)
- Ctrl + Plus
- Toggle double-size aka visitor mode. (plot-0.27)
Datafile format
The program supports datafiles listing the timestamp in the first column and data values in successive columns. Each line thus contains a set of samples of various data sources at the timestamp specified in the beginning of the line.
Supported timestamp units include "days since epoch", "seconds since epoch", "milliseconds since epoch" and "seconds since start of file". The timestamp can also be specified in decimal format, so 1139701996.123 in one file and 1139701996123 in another will be treated the same way.
The first row can contain a list of column headings, preferrably separated by TABs but spaces will do as well. The data values can also be separated by tabs or spaces. The headings must (at least currently) be in UTF-8 or ASCII format.
Example datafile (snippet from beginning of sample.txt):
#timestamp	roof °C	floor °C	table °C	outdoor °C	heater °C
1139701996	21.00		17.94		21.00		-11.75		43.06
1139702000	21.06		17.94		21.00		-11.75		43.06
1139702004	21.06		17.94		21.00		-11.75		43.06
1139702008	21.06		17.94		21.00		-11.69		43.00
1139702012	21.06		17.94		21.00		-11.69		43.00
1139702017	21.00		17.88		21.00		-11.69		43.00
1139702021	21.00		17.88		21.00		-11.69		43.00
1139702025	21.00		17.88		21.00		-11.69		43.06
1139702029	21.00		17.94		21.00		-11.69		43.06
1139702033	21.00		17.94		21.00		-11.69		43.00
...
In version 0.27, support for directives in data files was added. Directives control the way the data in the data file is interpreted. Currently only file-global directives are supported, later directives might support also tying them to some specific line, affecting that line or lines from that line onwards (depending on the directive).
Available directives:
- maxdiff(milliseconds)
- (plot-0.27) [This is currently a file-global setting but that might change later, so put it in the beginning of the file for now] Specify the maximum number of milliseconds between two consecutive samples for the samples to be considered continuous. Thus, if specifying maxdiff(2000), if there are two consecutive samples 3 seconds apart, they will be considered discontinuous and no connecting line will be drawn between them.
Directives are added at the end of a line (or on a separate line). Directives are identified by a #! prefix. No extra whitespace is supported. Some examples:
1139702000	21.06		17.94		21.00		-11.75		43.06 #!maxdiff(2000)

#!maxdiff(60000)
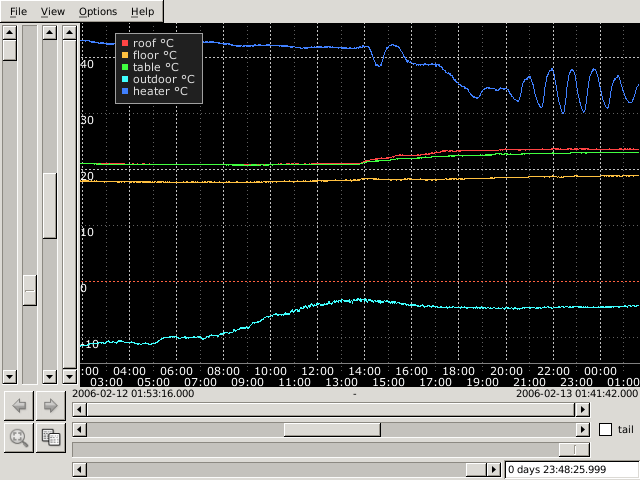
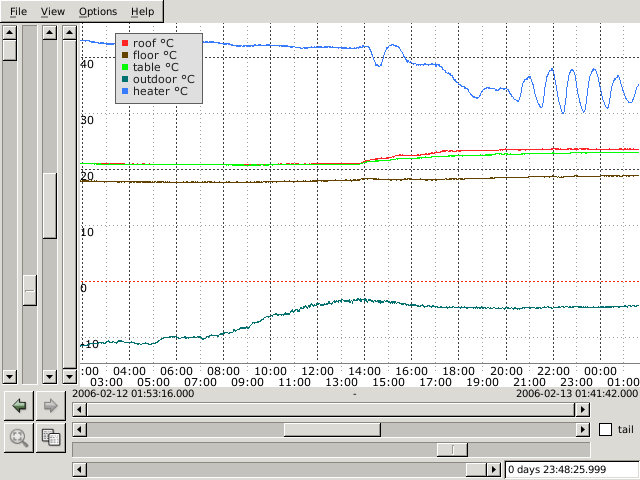
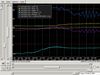
Screenshots from version 0.20
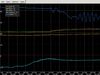
Main window at startup (when specifying sample.txt on the command line):
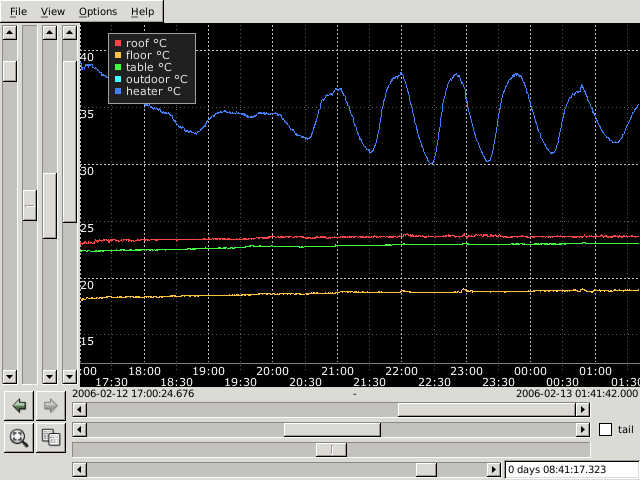
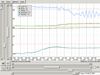
After zooming in the upper right part of the plot:
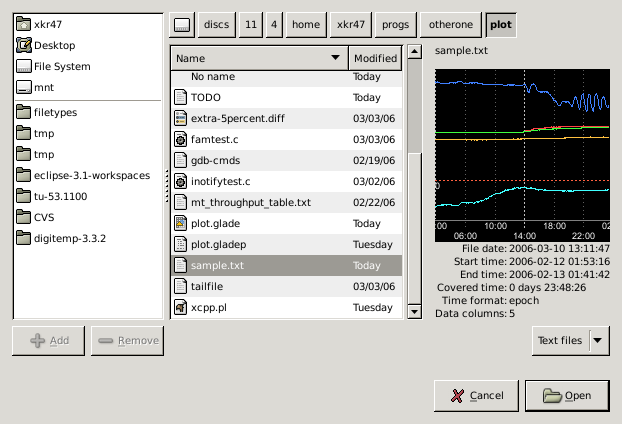
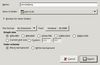
File open dialog has a preview window:
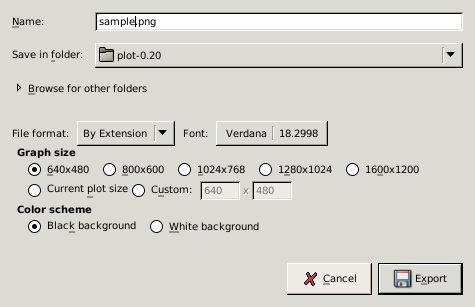
You can export the graph in various graphic formats, most importantly PNG (later maybe PS and PDF):
There's also a semi-fullscreen mode, leaving only the menu bar:
The colors can be inverted if you prefer white background:
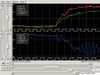
You can split the plot into multiple views to compare data with different y ranges with more precision:
You can open multiple files at the same time:
|